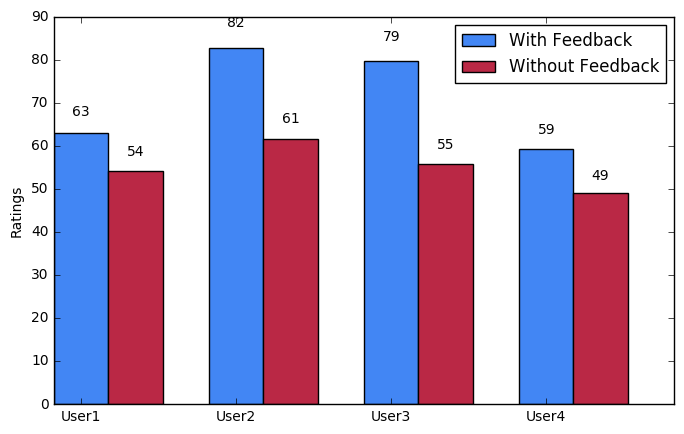
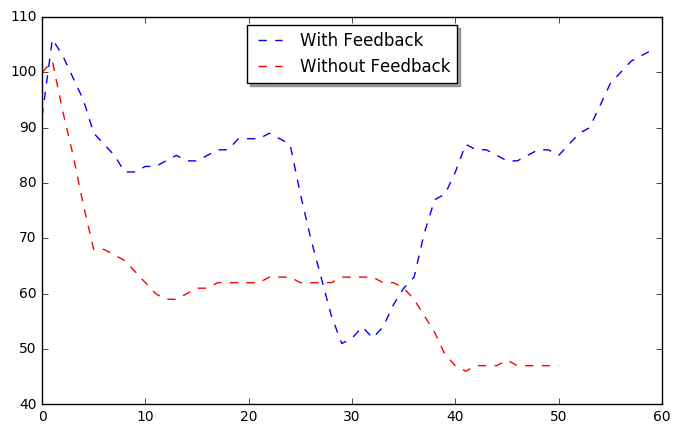
We did some tests with few users. Test was almost similar to what we described in earlier assingment. Each user was given some text to type on a computer. Each user was asked to type the text two time , one withthout feedback and once with feedback. While the user was typing in the text our device was recoring how good/bad their posture was at any time. Following are some plots based on the data we collected.
Fig.1- Average ratings of each userFig.2- Time series Rating for one the users
The task at hand was to come up with a good way to test the device. The output of our device is a rating which is a running score in real time which indicates how good user’s posture has been in last 10 mins. Therefore the data which we will be tracking in our tests will be average rating for a user.
The variable which we will be controlling is the feedback part of the device. That is, in one group of user we wont give them feedback (via leds) how good/bad their posture has been. Whereas second group of users will be given the approapriate feedbacks
Our device consists of two components , 1) The component which tracks how much user's joint is bent 2)Wrist band with leds which provides user feedback.
For the first group of users we will just give them the first component which monitors how much a particular joint is being bent at any given time. for the second group of users we will give them both devices. The data for both these groups can be collected and compared if the average rating of second group of users is better or not.
The task at hand was create the software component of the project. For our project the software component’s role is just to display data and give user feedback about how good / bad their posture has been over a period of time. The UI doesnt have any user interactions other than displaying data. The only interaction that current UI allows is to zoom in the timeline(x-axis) to view a range of time.
Data to be Visualized
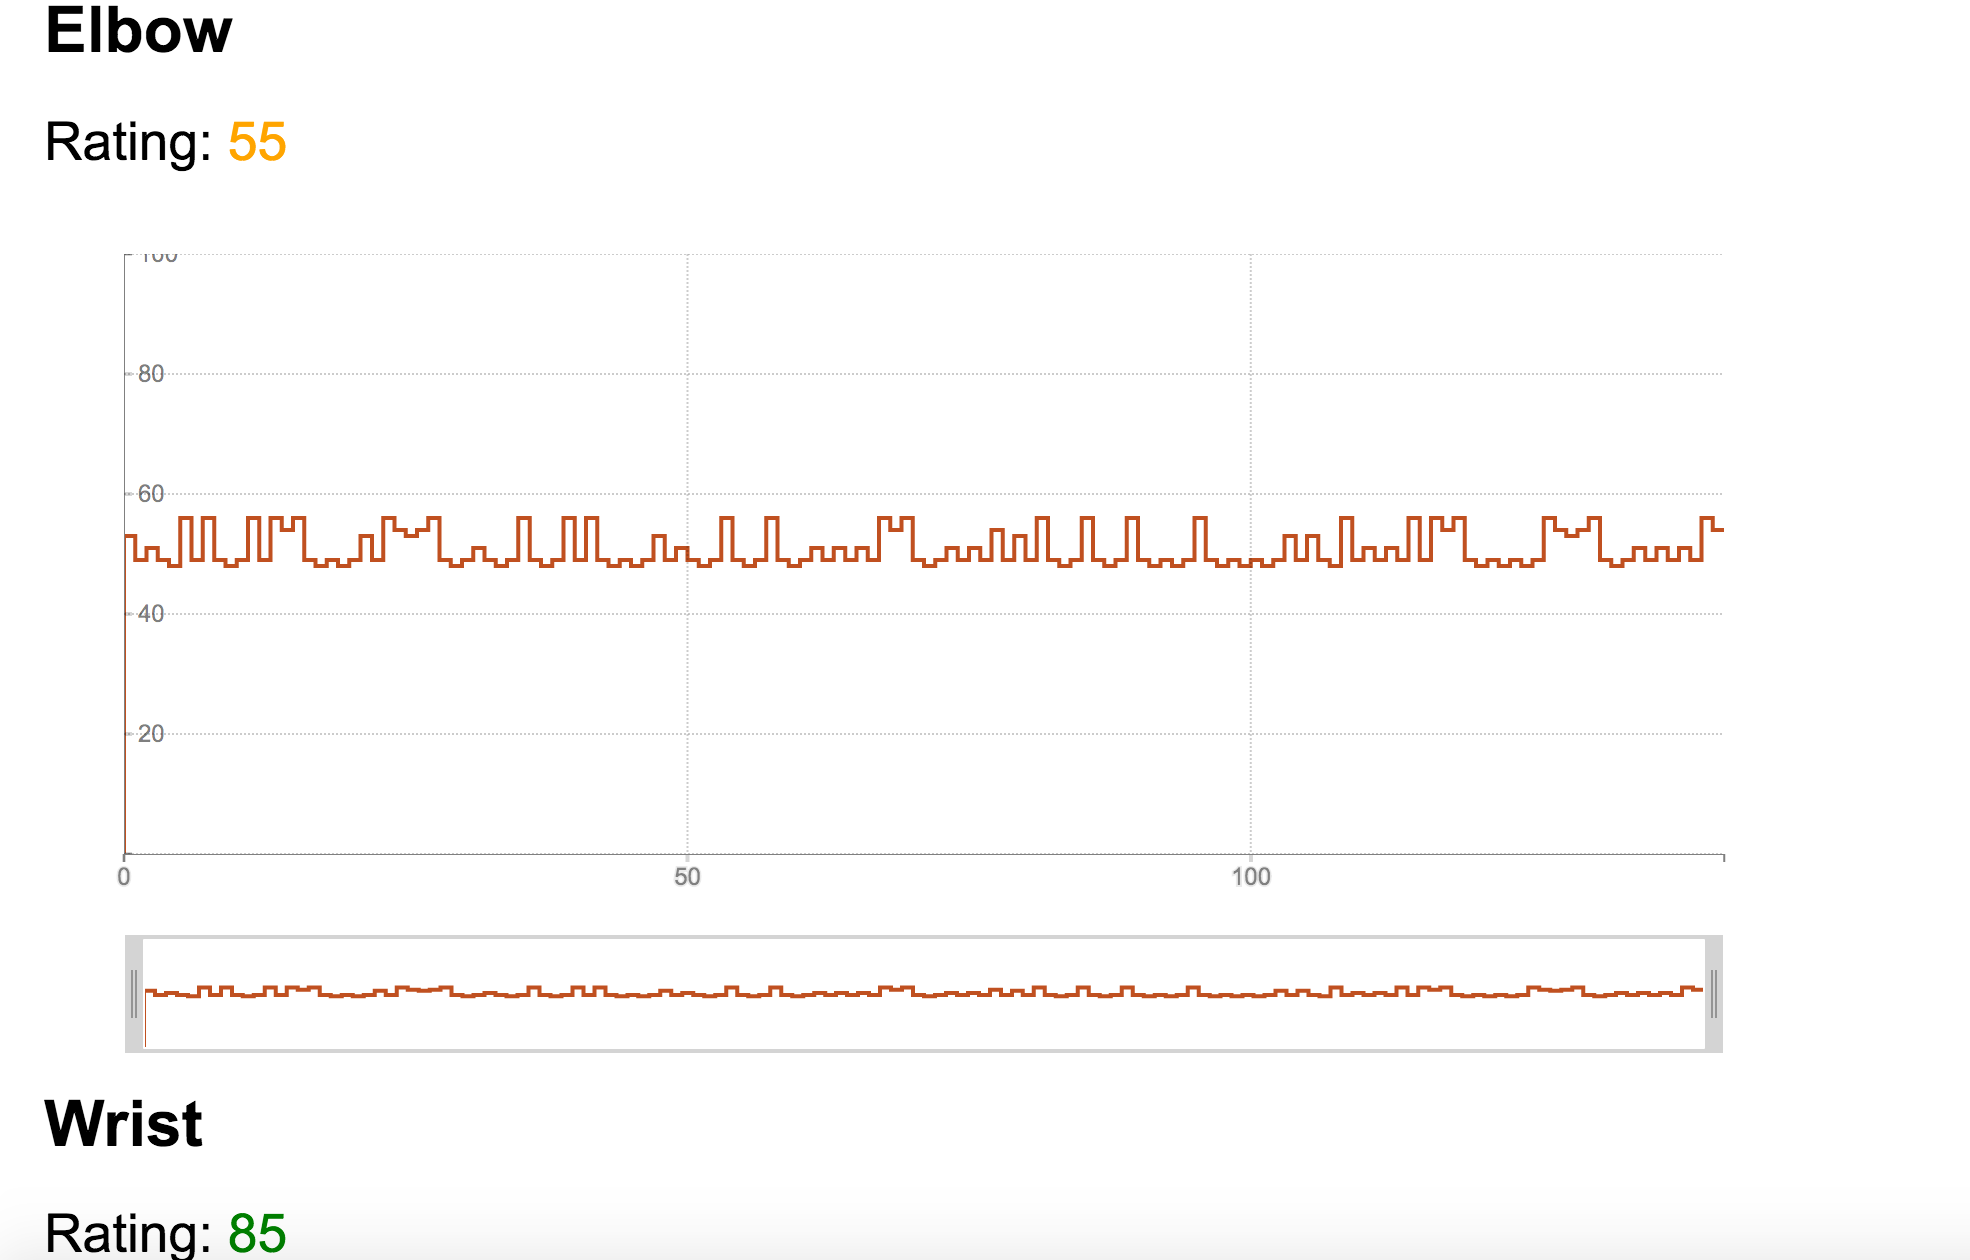
The UI which is currently a web application shows 2 types of information.
1) At any given time for what percentage of last minute user was in good posture. For example if user was in bad posture for total of 20 secs in last minute then current reading will be 66.66 .
2) Rating computed from the time series data and some simple heuristics which takes into account that user was in bad posture for small durations or large durations. For example if in one scenario during a minute user was in bad posture for continuous 10 secs and in other scenario user was in bad posture for 10 secs but not continuos , then the first scenario will be pernalized more.
Components
There are 3 component involved in the whole data visualization.
1) Arduino - will collect the data from sensors and aggregate the data.
2) Laptop - will collect data from Arduino and do the necessary processing so that UI (browser) can display the data.
3) Web Browser - pulls the processed data from server hosted on Laptop.
Communication
The communication between sensors and arduino are done via GPIO pins. Arduino does the aggregation of data and write it to serial port.
A server running on Laptop then reads the data from the serial port and does some minor processing on data to make it suitable to be sent to web browser.
The communication between server and browser is done via websockets. The server keeps on pushing the data on socket from where client code can read it and display it.
The task at hand was to kick start the implementation of the project by finalising the sensors to be used for the project and figure the way to collect data from the sensors.
Sensor
The main sensor which we are going to use is called flex sensor. This is basically a variable resistor whose resistor varies depending on how much we are bending the sensor from its neutral position.
From our experiments we found that the working range of our sensor was between 10k ohms to 60k ohms. That is in its neutral position it has resistance of about 10k ohms.
More information about the sensor can be found here
Cicuit
Our circuit was very simple voltage divider circuit with a fixed resistor and flex sensor connected in series. And we were reading the voltage across the fixed resistor.
We followed following tutorial to setup our circuit. Tutorial
Data Collection and Visualisation
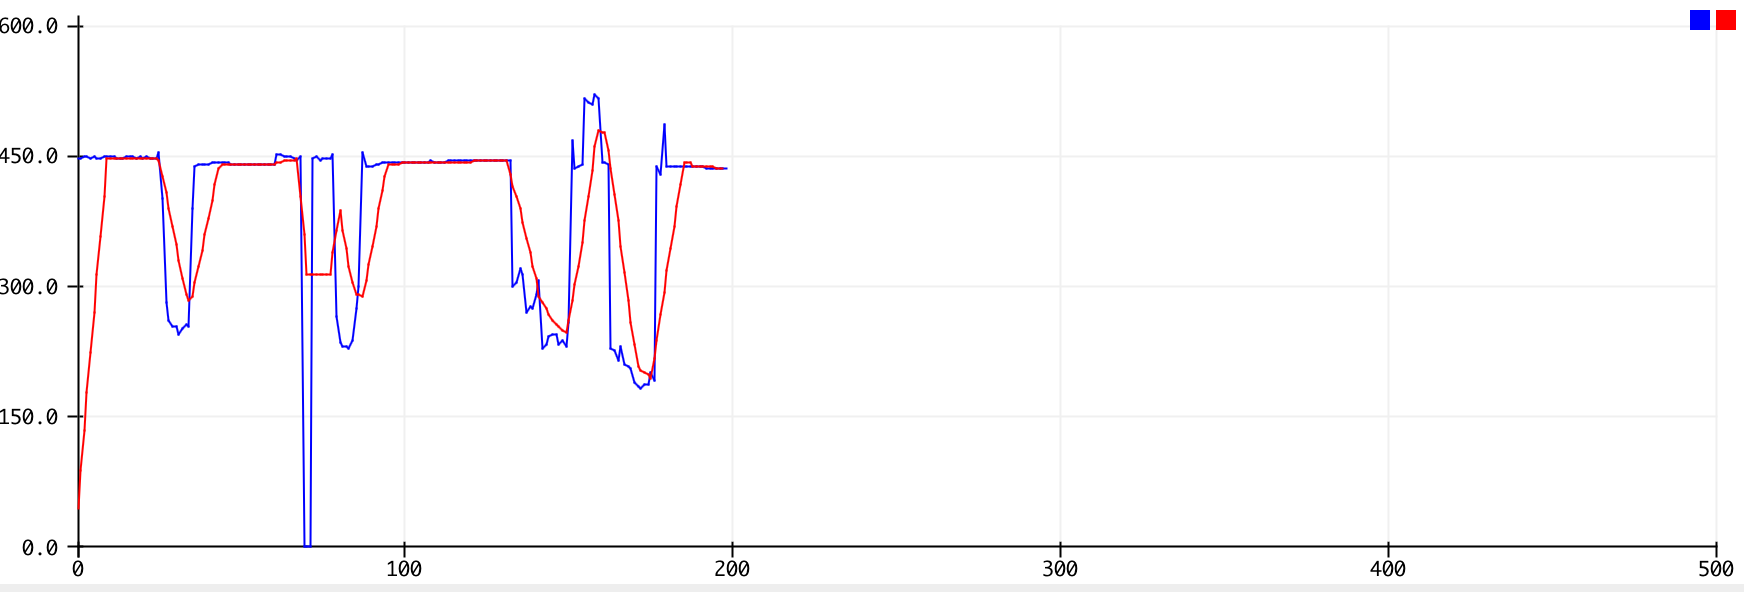
We used analog pin of arduino to get the readings from our circuit. To smoothen the readings we immplemented a simple average filter which works on a moving window. Following figure shows the plot of analog reading (range 0 - 1024) vs time. The red line is the filtered output and blue line shows the raw output.
From our experiments we found the reading of our circuit is around 450 is where the sensor is not being bent and hence it will be safe posture reading. Whereas values below 300 will be what which will trigger alerts for user to improve their posture.
In todays world as we are becoming more and more dependent on computer , we are spending increasing amounts of time sitting in front of computer. This prolonged sitting espcially in a bad posture can have some serious impacts on a person’s health. A quick google search will reveal that a big percentage of software engineers today suffer from some kind of body pain.
Ergonomics hold the solution to above problems but issue here is a person while working has to be constantly vigilant about his/her posture , which can be difficult sometimes because person has to focus on multiple things at same time. So what we propose is a wearable device which can do the monitoring on behalf of the person and provide him proper feedbacks when need arises.
Problem Statement
How to monitor posture of a user and provide him with appropriate feedbacks and stats.
Root cause analysis of the problem
1)why inefficient at work today -
because back pain
2)why back pain -
because sitting on chair for long time in bad posture
3)why bad posture for long time-
because engrossed in work and didnt pay attention
4)why didnt pay attention -
becuase nothing to bring my focus before the problem arise
Solution
What we propose is a wearable device which user can wear while working on a desktop. This device will be responsible for monitoring some of the key body parts for bad posture. And provide user with feedbacks whenever necessary.
Our proposed device has mainly three components -
Wearable sensors to collect data
Wrist band for feedback
App for visualizing the stats / pin pointing the problematic area
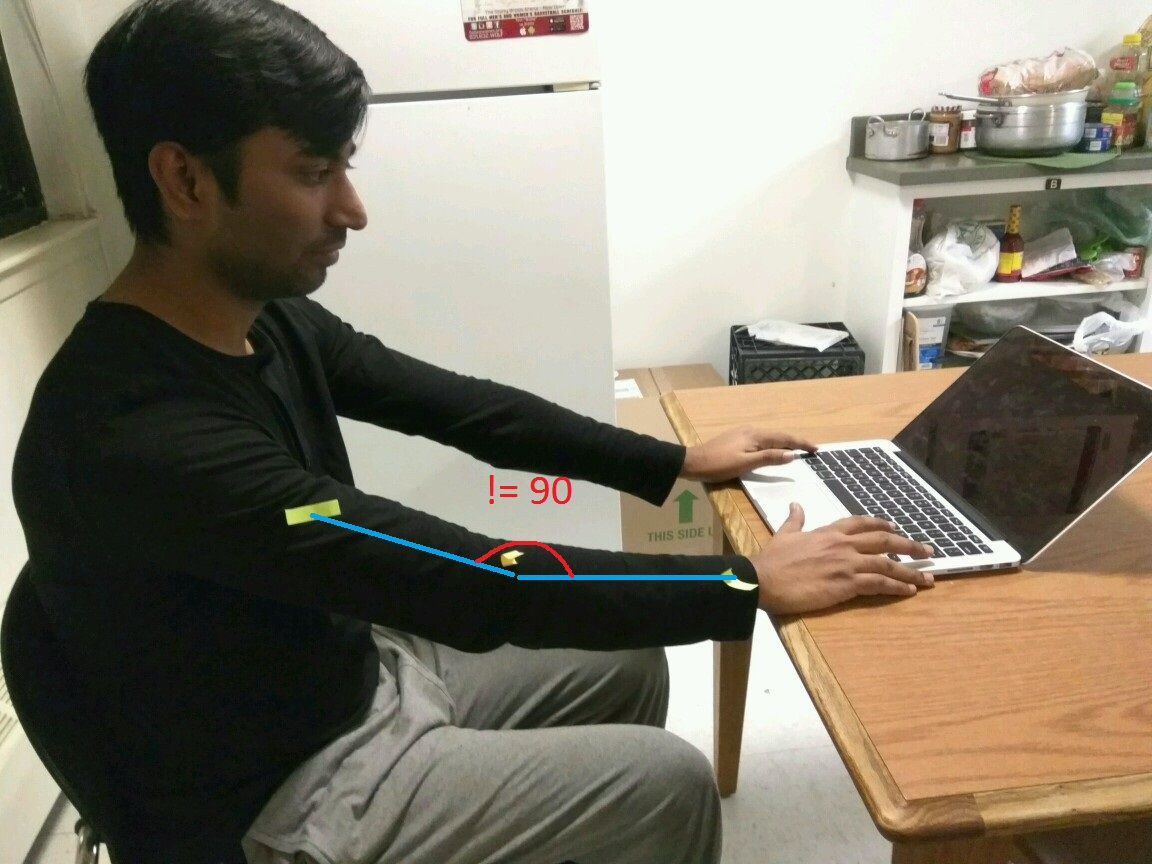
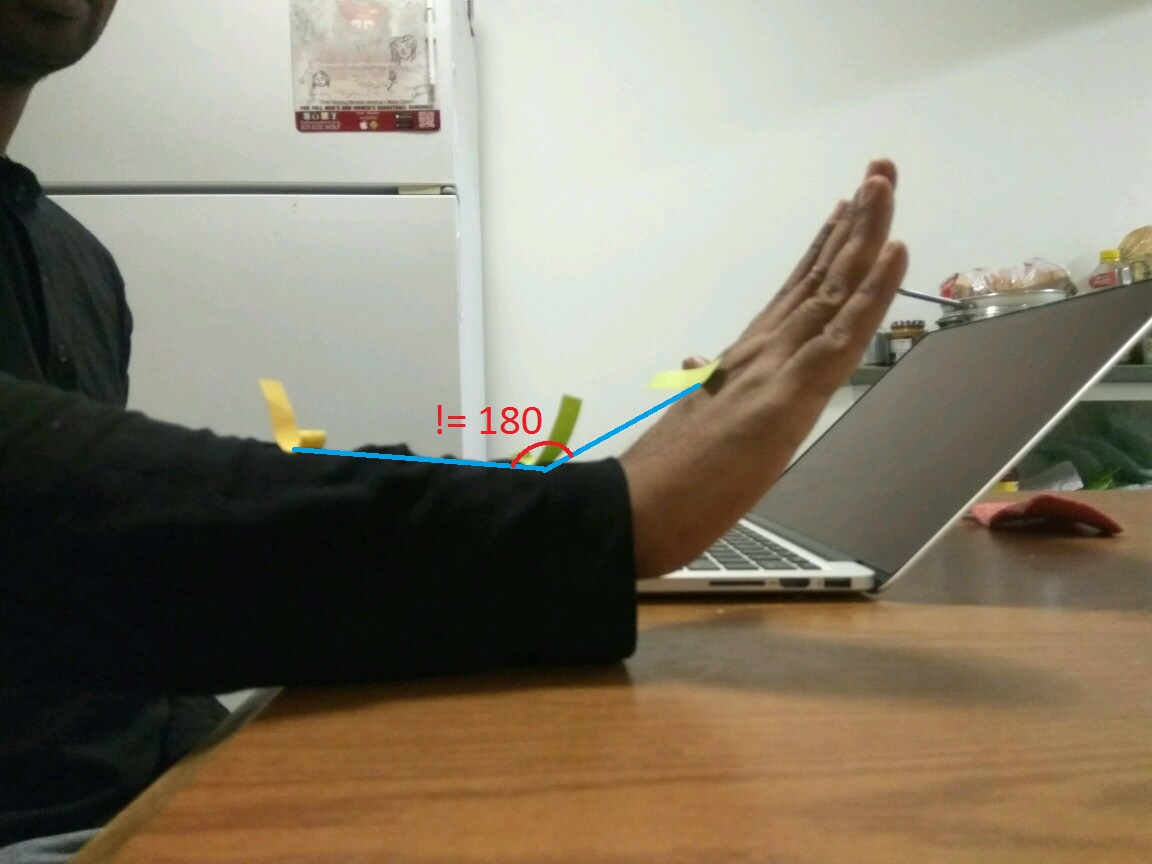
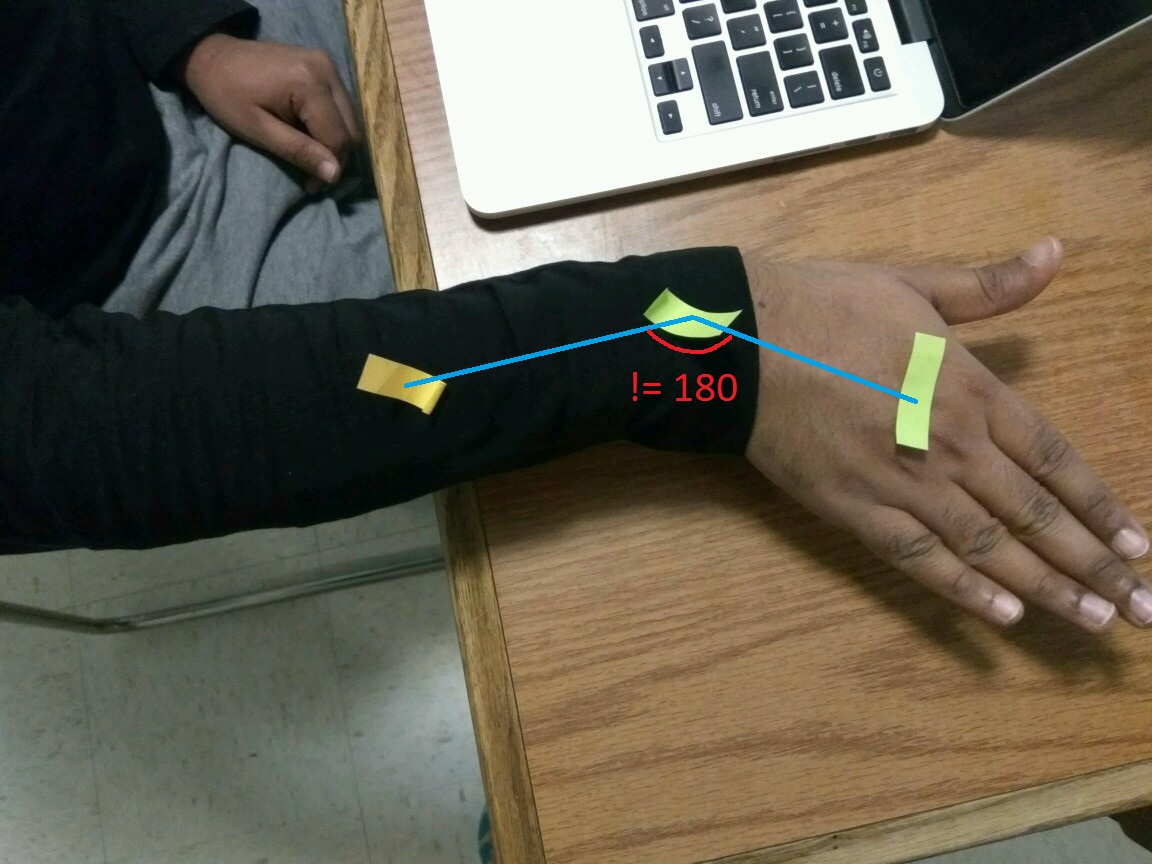
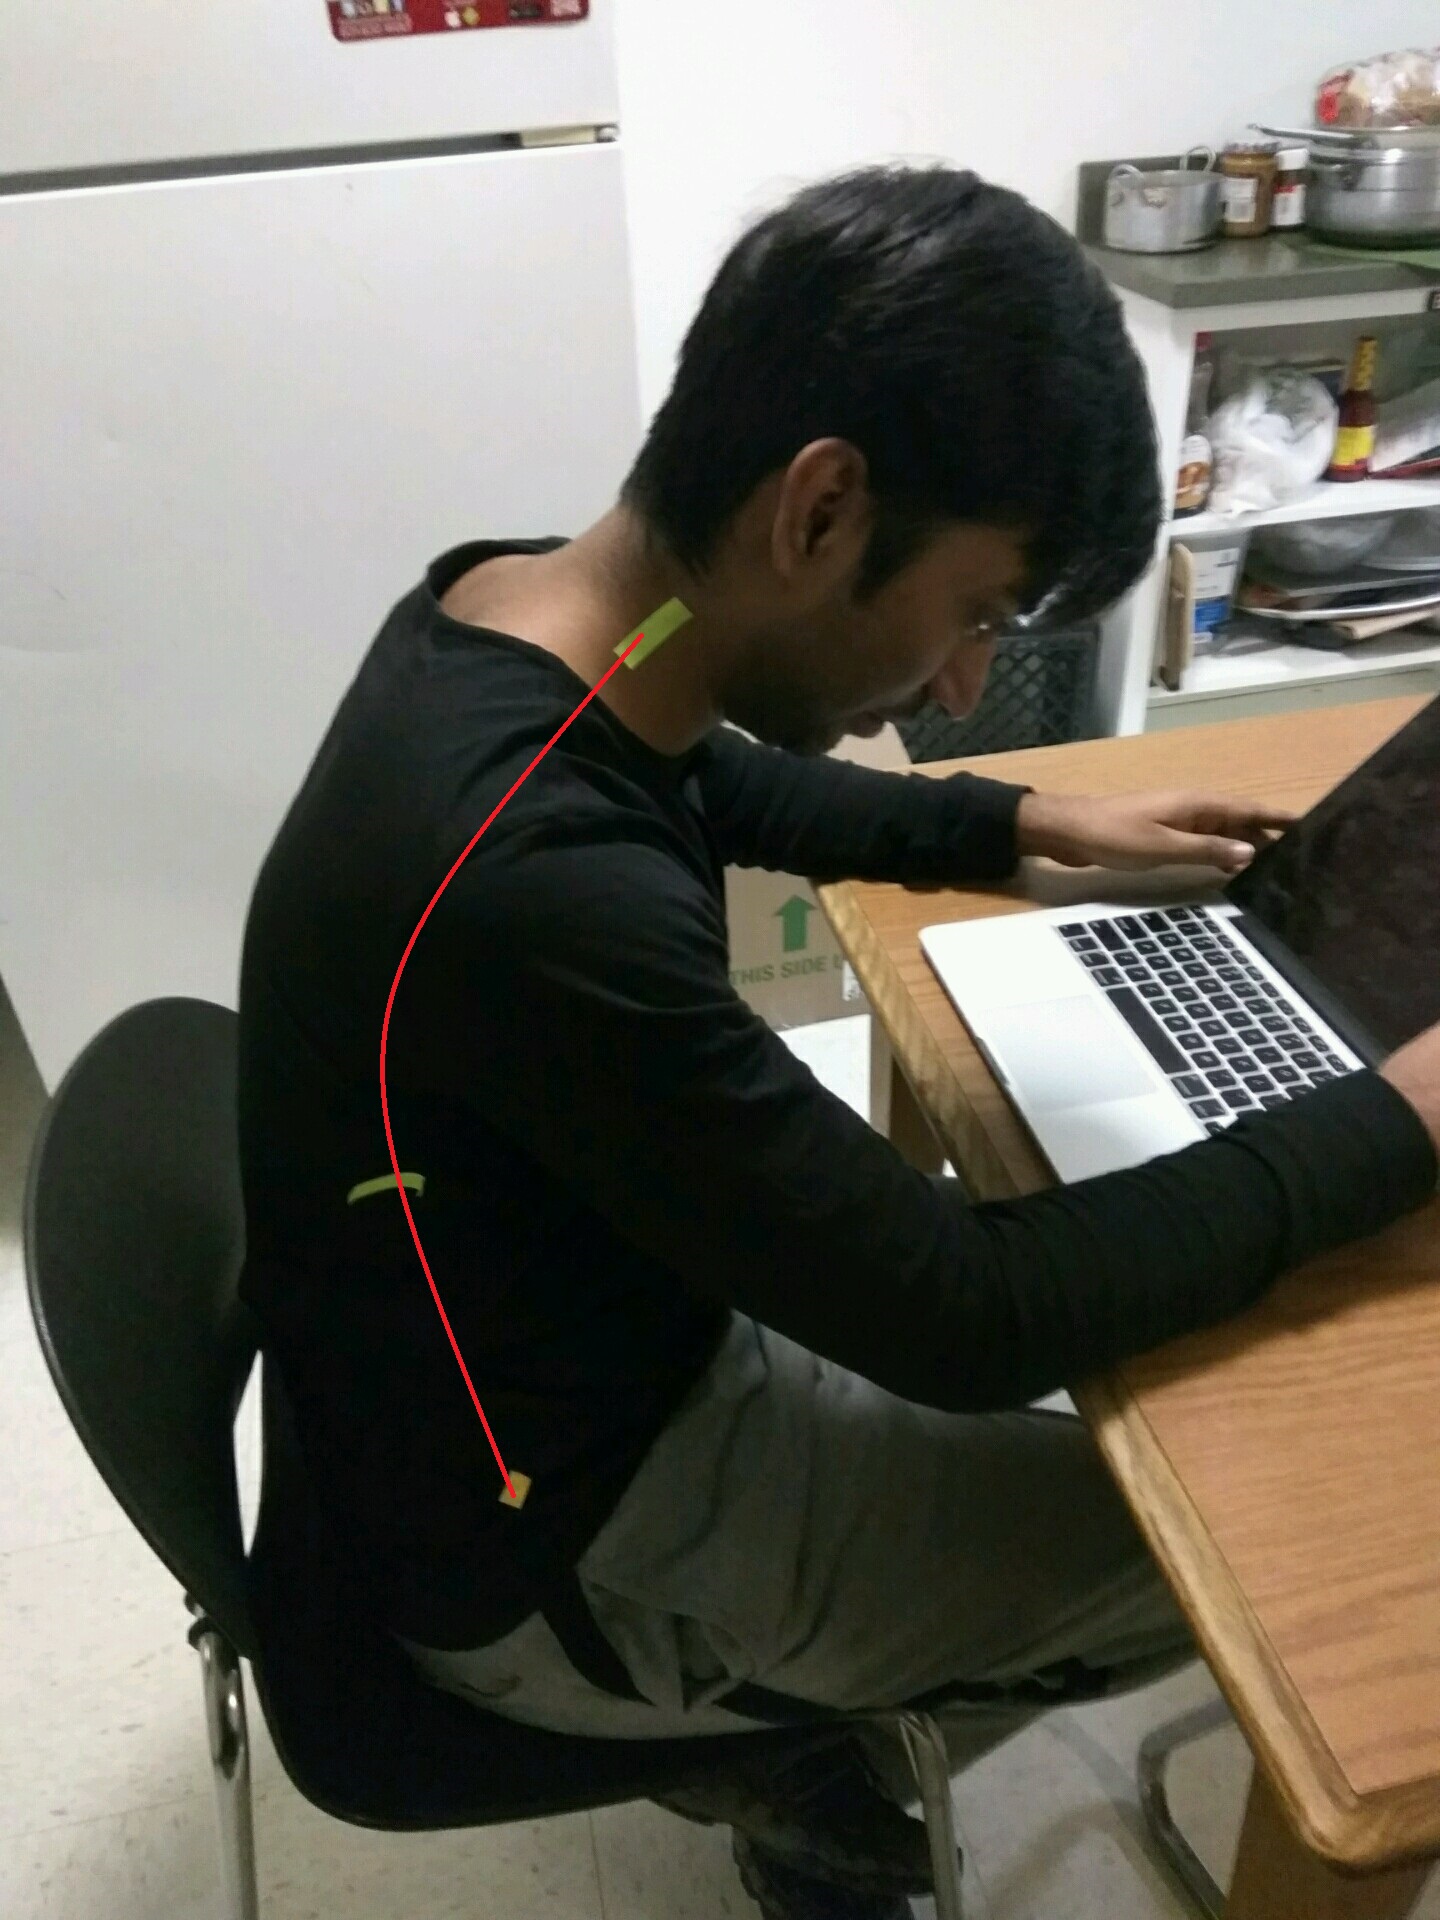
According to principles of Ergonomics every joint in the body has a neutral posture, and that is the posture everyone should maintain while working. Any serious deviation from this neutral posture for long duration can lead to problems. Our wearable sensors will be attached at some specific locations in the body , 3 sensors for every joint which we want to monitor. These sensors will be capable of sending their spacial 3d position to a central processing unit. This spatial information we can easily figure out what is the angle at that particular joint.
If the calculated angle is deviating more than a threshold then we can start recording the time. Once some x amout of time has passed in a bad posture we can send soft warnings in form of led color change in the wrist band. If user still missed the signal and continues their work then we can send stronger signals in form of vibrations in the wrist band.
Using the mobile app user can view the stats and figure out which part of the body was in bad posture and fix that accordingly.
Concept Video
A small video explaining the concept. Source video can he found here
Following images show how the sensors will be setup on some of our joints -